As a directional driller, you may need to enter surveys, slides, and rotates and use the capabilities of Drakewell to visualize well paths, plan ahead, and compare your progress to a well plan. Directional drillers can visualize plotting in real-time with Drakewell’s 3D plotting view. This feature ensures that you land the curve and don’t waste valuable time and assets by making a mistake. Being able to see your well path and calculate adjustments accurately will keep you a step ahead of the competitors and make your jobs more accurate and efficient.
Directional drilling will be changed forever with this 3D visualization software that lets drillers know exactly where they are drilling underground. No more calculations on spreadsheets and confusing software that is supposed to be your friend (but it’s really your enemy). The 3D plotting software feature is just one part of a whole platform made for oil and gas field service companies. This feature of Drakewell is amazing industry leaders and evoking audible gasps when revealed. That’s when we really know its something special.
Plot Your Path
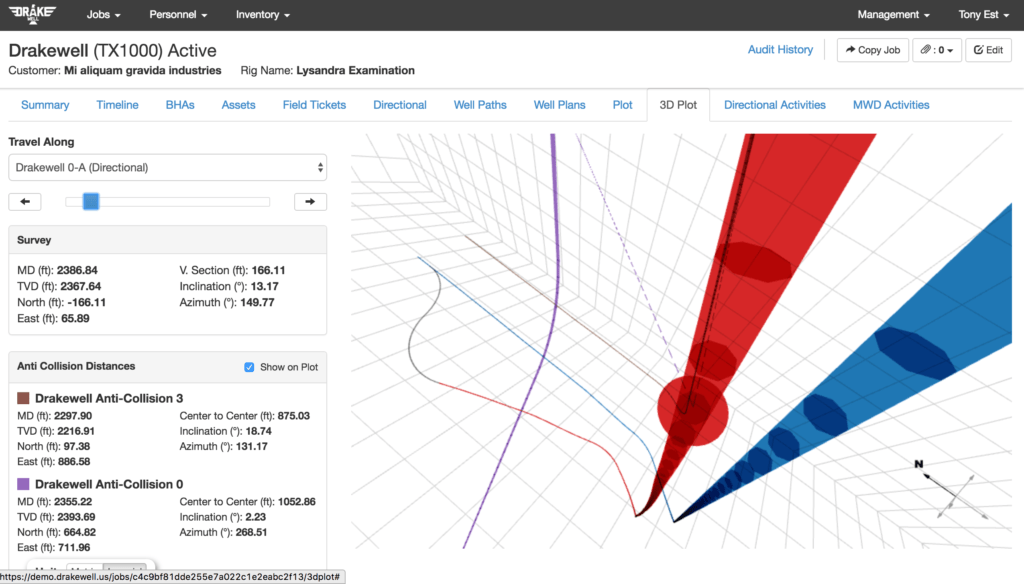
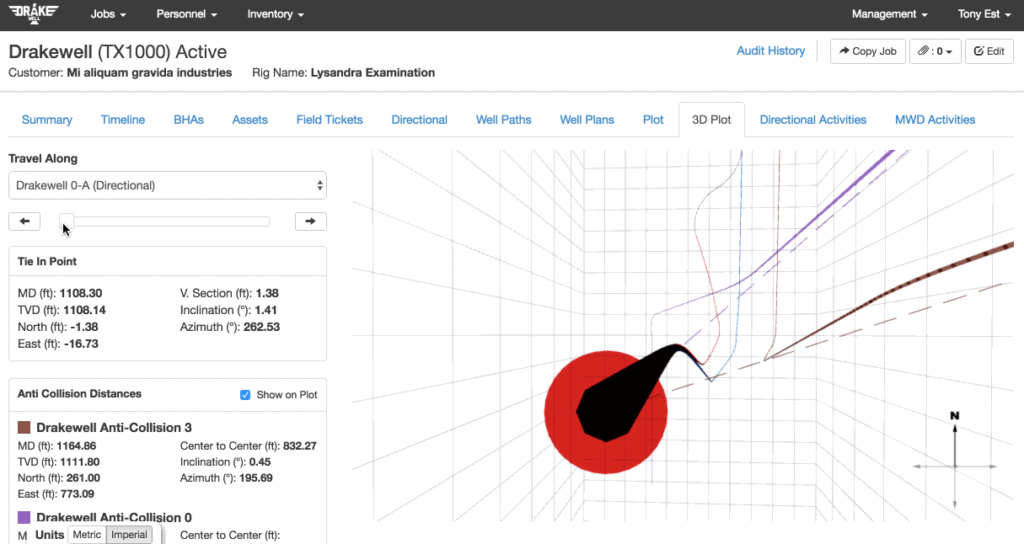
Drakewell’s plot utilizes survey data that you provide to show you a 3D view of your drilling progress. Use this feature to track your actual progress against the plan and visualize any deviations in 3D space. Drakewell allows you to see detailed information on each plot point. With this, you will be able to see survey information for points where you began to deviate from the original plan and enables you to efficiently make corrections, saving you valuable time and money.

In the image above, the blue line is your planned path. The red line is your actual path. The slider on the left side of the image is a button you can click and drag to slide left to right to follow your actual path (in red) downhole. You can see the survey information for each plot point on the left-hand side of the screen under “survey.”
Anti-Collision
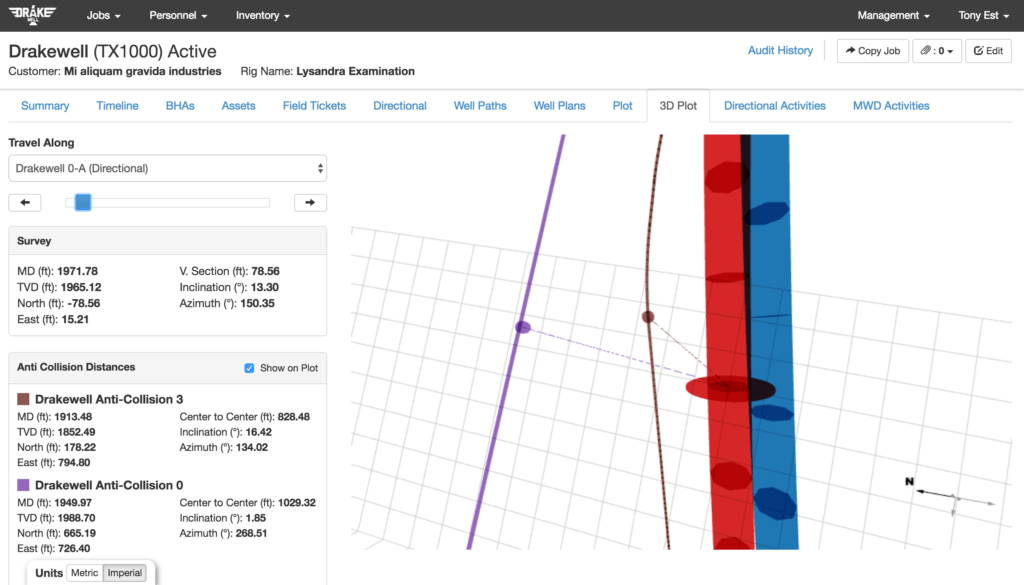
This feature will allow you to visualize nearby wells, helping you to avoid a disastrous situation. You can have multiple anti-collision paths and see as many or as few as you like. In our example, there are two anti-collision paths. One is the purple line and the other is the brown line.

In the image above, you can see dashed lines from the red path (your actual well path) to two different anti-collision paths. Drakewell constantly measures anti-collision center to center distances and gives you the data on the left-hand side of the screen.
Targets
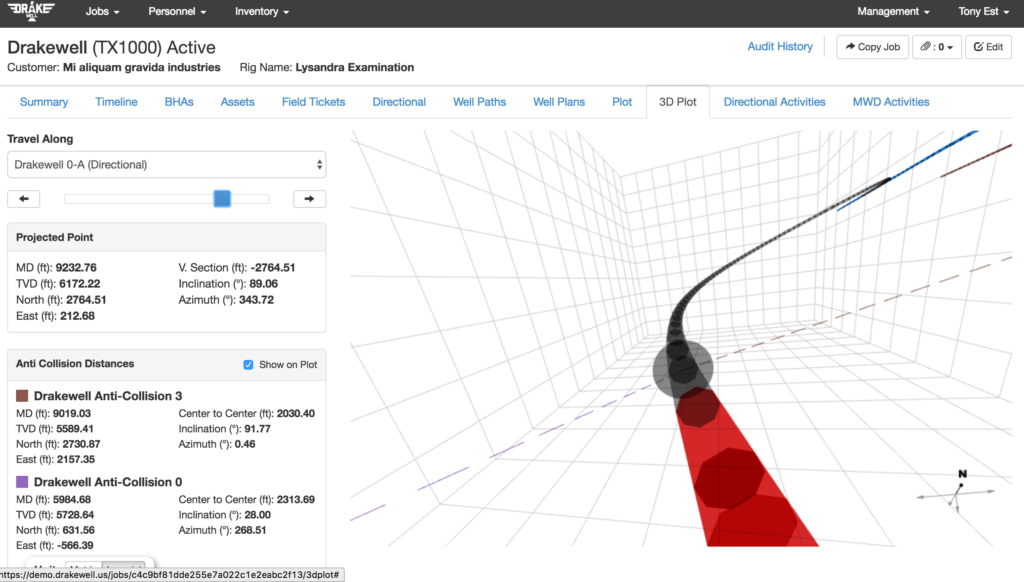
When you are drilling the well and get off the blue planned path, Drakewell enables you to set a new target to get back on track. Drakewell calculates the path you need to take to get back to target and colors the target path in gray to help you visualize your plan of action and make better decisions on or off the field.
Sliding & Rotating
Easily track your measurements while drilling all in one place and get quick calculations without using paper, spreadsheets or a calculator. Drakewell allows you to quickly record your measurements to get the most accurate calculations to hit your target. You can maintain a consistent record of all of your measurements in one place. This technology will put you ahead of the rest in the industry and reduce the amount of time and effort between measurements.
Projection to Bit
Using your survey data, Drakewell calculates the projection to bit to eliminate any guesswork and mitigate risk of human error.

In the image above, you see that the red line turns gray. The gray line is the calculated path to the target you entered to get back to the blue planned well path. Drakewell calculates the path you need to take to get back on the planned blue path and provides the gray line to help you visualize your plan of action.
See Drakewell in action:

The red line represents your actual well path and the blue line is the well plan. The other lines you see are anti-collision paths that you have uploaded in the area. When the red line (where you are drilling) starts to deviate off the path, Drakewell will calculate exactly how to get back on plan. The projected path to get back to the plan is the gray line you see connecting the red line back to the blue line. If you stop at any given point (survey), the survey data and the information on the closest center to center anti-collision path points will pop up on the left-hand side. We know… its pretty cool.
Drakewell is designed for the everyday user, not technology experts. Drakewell is simple, clean, and practical. It helps your team to work smarter, faster, and more efficiently. Stop being bogged down by confusing software that doesn’t work on all devices. Use Drakewell from the field or office on any device, anytime. No frustration required.
